Woodwork for Inventor JS Macro is a small JavaScript program. Like all programs, it needs to be debugged. This debugging is the point at which JS Macro is placed in the context of the part to be cut and becomes part of the sculpt processing operation in Woodwork for Inventor CAM. At this point, all the data necessary to interpret the JS Macro program already exists, so that debugging of the JS Macro program is already possible at this point.
Debugging of the program is available from the Woodwork for Inventor CAM technology side browser when the RMB context menu is called up for the selected Macro debugging and the menu item “Properties” is selected.
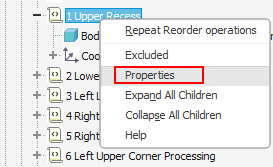
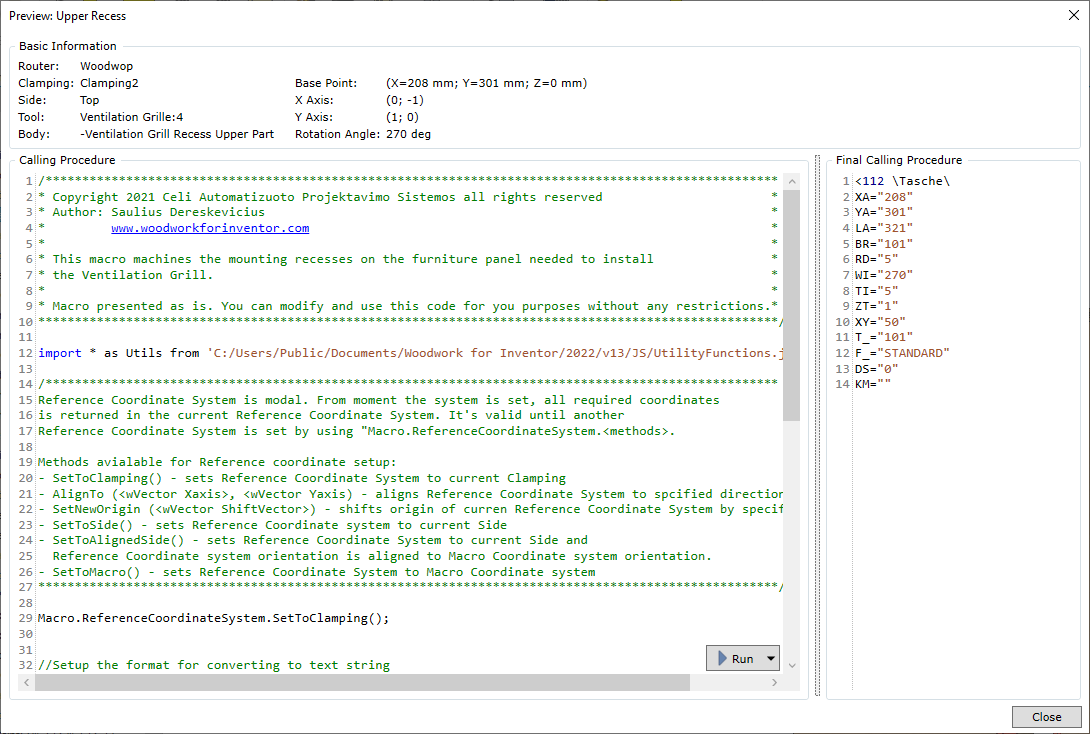
The command calls the debugging window.
Basic Information |
|
Basic information about the Macro to be debugged. |
||||||||||||||||||||
|
Router: |
The CNC machine for which this JS Macro program is designed. |
||||||||||||||||||||
|
Clamping: |
The name of the clamping to which the JS Macro belongs. |
||||||||||||||||||||
|
Side: |
The processing plane/side of the part to which the given JS Macro is assigned. |
||||||||||||||||||||
|
Tool: |
The name of the component that was used to cut the opening and will be processed by the given JS Macro. |
||||||||||||||||||||
|
Body: |
The name of the solid body that belongs to the cutting component and to which the given Macro has been registered. |
||||||||||||||||||||
|
Base point: |
The coordinates of the base point of the JS Macro, expressed in the plane/side coordinate system. |
||||||||||||||||||||
|
X Axis: |
The X-axis orth of the coordinate system of the base point of the JS Macro, expressed in the plane/side coordinate system. |
||||||||||||||||||||
|
Y axis: |
The Y-axis orth of the coordinate system of the base point of the JS Macro, expressed in the plane/side coordinate system. |
||||||||||||||||||||
|
Rotation Axis: |
The angle of rotation of the base point coordinate system of the JS Macro. The angle is specified between the X axis of the side and the X orth of the JS Macro coordinate system.
|
||||||||||||||||||||
Calling Procedure |
|
A text editor that displays the contents of the Macro program. In this window it is possible to make adjustments to the Macro program.
|
||||||||||||||||||||
|
Run |
Runs the program. The result of this is visible in the Final Calling Procedure window on the right. |
||||||||||||||||||||
|
Debug |
In case the simple run mode is not enough, it is possible to perform step-by-step tracing of the program in debug mode. In order to be able to do this, the user must first install the freely available Microsoft Visual Studio Code program editor on his/her computer. In case the simple run mode is not enough, it is possible to perform step-by-step tracing of the program in debug mode. In order to be able to do this, the user must first install the freely available Microsoft Visual Studio Code program editor on his/her computer and set it as Macro application editor in System Settings.
.
|
||||||||||||||||||||
Final Calling Procedure |
|
Displays the result of executing the JS Macro program. This text will be included in the final program when the user executes the output of the full CAM processing technology.
|
||||||||||||||||||||
Close |
|
Closes the Woodwork for Inventor JS Macro editor. All changes are saved in the content of the debugged JS Macro. |
After the debugging is complete, the user can run the output of the CNC program in the Front-End CAM system. For example, in Woodwop it is possible to open the given program and check if the result is as expected. It should be borne in mind that the given alignment result only exists in the CAM technology of the cut component. The cutting component still does not have the code of the JS Macro program debugged and modified.
How do I transfer the content of the debugged JS Macro program to the cutting component?
This can be done very simply:
| ▪ | Open the JS Macro Properties window in the CAM technology, which contains the correct JS Macro program text. |
| ▪ | Select it all (by pressing CTRL+A). |
| ▪ | Copy the text to the Windows buffer (by pressing CTRL+C). |
| ▪ | Close the window. |
| ▪ | Open the cutting component. |
| ▪ | The Macro editing command opens the Macro itself. |
| ▪ | In the edit window, select the entire text of the Macro (by pressing CTRL+A). |
| ▪ | Paste the text from the Windows buffer in place of the selected text (by pressing CTRL+V). |
| ▪ | Close the window. |
| ▪ | Save the component. |
| ▪ | The cutting component can now be used with the Macro already debugged. |
Note that the Sculpt command is optimised in a certain way. If the cutting component does not change the geometry of the cut parts (does not perform the cut during resculpt), it means that it does not re-cut the cut parts and does not transfer the updated JS Macro content to them. So, if you want to see the result of your edit, you need to use the sculpt command to first remove the cuts and then repeat them. Only then will the new Macro content appear in the cut part. The other way is to simply change the position of the cutting component in the design. In this case, the sculpt command will be forced to re-perform the sculpting operations.